2017年10月13日 星期五

Week6

Evaluating a Hypothesis

  • 為了要評量hypothesis,將data分成training set跟test set
    • 一般來說70%作為training set,30%作為test set
  • 新的步驟如下:
    • 利用training set去學習出$\Theta$使得$J_{train}(\Theta)$為最小
    • 計算test set error $J_{test}(\Theta)$

The test set error

  • For linear regression
    • $J_{test}(\Theta) = \dfrac{1}{2m_{test}} \sum_{i=1}^{m_{test}}(h_\Theta(x^{(i)}_{test}) - y^{(i)}_{test})^2$
  • For classification
    • Misclassification error (aka 0/1 misclassification error)
    • $err(h_\Theta(x),y) = \begin{matrix} 1 & \mbox{if } h_\Theta(x) \geq 0.5\ and\ y = 0\ or\ h_\Theta(x) < 0.5\ and\ y = 1\newline 0 & \mbox otherwise \end{matrix}$
      • 預測失敗就設1,成功就設0
    • 平均的test error為:
      • $\text{Test Error} = \dfrac{1}{m_{test}} \sum^{m_{test}}_{i=1} err(h_\Theta(x^{(i)}_{test}), y^{(i)}_{test})$

Model Selection and Train/Validation/Test Sets

  • 由於hypothesis在training set表現好,未必代表在test set也能表現好,所以不能只依據training set的表現來評斷hypothesis
  • 其中一個解決此問題的方法是多增加一組data set稱為cross validation set
    • Training set: 60%
    • Cross validation set: 20%
    • Test set: 20%
  • 當我們想要選擇model的polynomial degree時,可以照下列步驟:
    • 針對不同polynomial degree分別算出在training set最佳的Θ
    • 將各個Θ用在validation set找出error最小的degree
    • 在test set上算出上一步驟degree的error作為generalization error

Learning Curves

  • Bias很大的影響
    • N很小時,較容易找出quadratic curve來fit data,所以train error很小。
    • N很小時,train出來的hypothesis對於test set來說不準的機率大很多,所以test error很高。
    • 隨著N增大,兩種error都會進入停滯期。
    • 如果train出來的hypothesis的bias很大,增加training set size不會有幫助。
  • Variance很大的影響
    • 若Variance很大,則N要很大才會進入停滯期。
    • 若train出來的hypothesis的Variance很大,增加training set size是有幫助的。

Deciding What to Do

  • 當預測失準時,我們可以做下列的修正:
    • 取得更多training data
      • 適用於high variance
    • 將features拆成更小的sets
      • 適用於high variance
    • 增加新的features
      • 適用於high bias
    • 嘗試polynomial features
      • 適用於high bias
    • 減小λ
      • 適用於high bias
    • 增大λ
      • 適用於high variance

Error Analysis

  • 以下是建議用以解決machine learning問題的方法:
    • 快速實作出一個最簡單的演算法,並及早在cross validation set上做測試
    • 畫出learning curve以決定是需要更多data還是更多feature
    • 人工檢視那些在cross validation set上錯誤的例子,看發生最多錯誤的原因為何
  • 必須要能以一個數字來評估演算法(例如:錯誤率),舉例來說,當在考慮某個feature是否該加進去,若加進去後錯誤率反而增加就知道不該把它考慮進去。

Error metrics for skewed classes

  • 若分類問題中,兩個結果會發生的機率過於極端,則稱此情況為skewed classes
    • 例如:資料中只有0.5%會得到癌症
    • 做training的error rate可能比用猜的機率還低...
  • 改用Precision跟Recall來評估演算法的performance
    • 要將題目中機率特別小的設為y = 1
    • 做下列定義

    • Precision
      • $\text{Precision} = \frac{\text{True positives}}{\text{# predicted as positive}} = \frac{\text{True positives}}{\text{True positives + False positives}}$
    • Recall
      • $\text{Recall} = \frac{\text{True positives}}{\text{# actual positives}} = \frac{\text{True positives}}{\text{True positives + False negatives}}$
  • 要怎麼用單一數值來評估Precision跟Recall的表現呢
    • 使用F1 Score (或稱為F Score)
      • $2\frac{PR}{P+R}$


2017年9月24日 星期日

Week5

Cost Function

  • 首先定義一些在neural network會用到的變數
    • L:在這個network中有幾層layer
    • $s_l$:在這個layer中有幾個unit (不含bias unit)
    • K:總共有幾個output unit,即結果分成幾類
    • $h_\Theta(x)_k$:產生第k個output的hypothesis
  • Neural network的cost function定義如下:
  • \begin{gather*} J(\Theta) = - \frac{1}{m} \sum_{i=1}^m \sum_{k=1}^K \left[y^{(i)}_k \log ((h_\Theta (x^{(i)}))_k) + (1 - y^{(i)}_k)\log (1 - (h_\Theta(x^{(i)}))_k)\right] + \frac{\lambda}{2m}\sum_{l=1}^{L-1} \sum_{i=1}^{s_l} \sum_{j=1}^{s_{l+1}} ( \Theta_{j,i}^{(l)})^2\end{gather*}

Backpropagation Algorithm

  • Backpropagation是neural network中用來表示最小化cost function的術語,就如同在logistic及linear regression中所用的gradient descent
    • 目標是計算:$\min_\Theta J(\Theta)$
  • 在這一節中我們來看看如何計算J(Θ)的偏微分
    • $\dfrac{\partial}{\partial \Theta_{i,j}^{(l)}}J(\Theta)$
  • 演算法:
    • 給定一組training set $\lbrace (x^{(1)}, y^{(1)}) \cdots (x^{(m)}, y^{(m)})\rbrace$
      • 設定$\Delta^{(l)}_{i,j}$ for all (l,i,j)
      • $\Delta$代表的是error
    • For training example t =1 to m:
      • 設定$a^{(1)} := x^{(t)}$
      • 使用forward propogation計算$a^{(l)}$ for l=2,3,…,L
      • 利用$y^{(t)}$計算$\delta^{(L)} = a^{(L)} - y^{(t)}$
        • 這是最後一個layer的error
        • $\delta$是$\Delta$的小寫
        • 將最後一層得到的結果跟正確值y相減
      • 計算最後一層layer之前的$\delta^{(L-1)}, \delta^{(L-2)},\dots,\delta^{(2)}$
        • 使用$\delta^{(l)} = ((\Theta^{(l)})^T \delta^{(l+1)})\ .*\ a^{(l)}\ .*\ (1 - a^{(l)})$
        • 後面兩項代表的是$g'(z^{(l)}) = a^{(l)}\ .*\ (1 - a^{(l)})$,也就是對$g(z^{(l)})$的微分(g-prime derivative)
      • $\Delta^{(l)}_{i,j} := \Delta^{(l)}_{i,j} + a_j^{(l)} \delta_i^{(l+1)}$
        • 或是用vector計算:$\Delta^{(l)} := \Delta^{(l)} + \delta^{(l+1)}(a^{(l)})^T$
    • 最後可以得到新的$\Delta$ matrix
      • 若j≠0
        • $D^{(l)}_{i,j} := \dfrac{1}{m}\left(\Delta^{(l)}_{i,j} + \lambda\Theta^{(l)}_{i,j}\right)$
      • 若j=0
        • $D^{(l)}_{i,j} := \dfrac{1}{m}\Delta^{(l)}_{i,j}$
      • D是作為accumulator用來將所有的值加起來以求出最後的偏微分
        • $\frac \partial {\partial \Theta_{ij}^{(l)}} J(\Theta)$ = $D_{ij}^{(l)}$

Backpropagation Intuition

  • $\delta_j^{(l)}$代表的是在$a^{(l)}_j$的error,實際上也可以看成cost function的微分
    • $\delta_j^{(l)} = \dfrac{\partial}{\partial z_j^{(l)}} cost(t)$
  • 以下面這張圖為例:

    • 第二層的$\delta_2^{(2)}$可透過第三層的$\delta_1^{(3)}$及$\delta_2^{(3)}$來得到
      • $\delta_2^{(2)}$ == $\Theta_{12}^{(2)}$*$\delta_1^{(3)}$+$\Theta_{22}^{(2)}$*$\delta_2^{(3)}$

Gradient Checking

  • Gradient checking可以用來確保我們的back propagation是正確的
  • Cost function的微分結果可以用下列式子來做近似:
    • $\dfrac{\partial}{\partial\Theta}J(\Theta) \approx \dfrac{J(\Theta + \epsilon) - J(\Theta - \epsilon)}{2\epsilon}$
  • 而對於有多個theta的矩陣,對於$Θ_j$微分的近似值則如下:
    • $\dfrac{\partial}{\partial\Theta_j}J(\Theta) \approx \dfrac{J(\Theta_1, \dots, \Theta_j + \epsilon, \dots, \Theta_n) - J(\Theta_1, \dots, \Theta_j - \epsilon, \dots, \Theta_n)}{2\epsilon}$
  • 將epsilon設小(${\epsilon = 10^{-4}}$)可確保數學式子是正確的
  • 淡epsilon若設的過小會遇到數值上的問題
  • 將近似的結果跟用back propagation得到的delta做比較,若結果正確的話數值不會差太多
  • 由於實作上近似值的計算很慢,所以在檢查完back propagation演算法後就不要再多做了!

Random Initialization

  • 在neural network中若將weight的初始值都設為0的話,在做back propagate時所有的node都會被update成相同的數值,這樣會大大降低準確度
  • 所以我們應該將$\Theta^{(l)}_{ij}$設成介於$[-\epsilon,\epsilon]$間的隨機值
    • 這裡的epsilon跟gradient checking的沒有關聯
    • epsilon比較好的選擇如下圖,Lin/Lout為該Layer input/output的unit數量

  • 首先要選擇network architecture,hidden unit有幾個,要分成幾個layer
    • hidden unit:越多越好,但要衡量計算成本
    • hidden layer:預設為1層,若超過1層,則建議每一層的hidden unit數目一樣\
  • Training a Neural Network
    • 隨機初始化weights
    • 實作forward propagation以求得$h_\Theta(x^{(i)})$
    • 實作cost function
    • 實作back propagation以算出cost function的偏微分
    • 跑一次gradient checking確認back propagation是對的
    • 使用gradient descent或內建的最佳化方式求出讓cost function最小的weights

2017年9月20日 星期三

Week4

Neural Networks

  • 在model中,input是$x_1\cdots x_n$的features,output是hypothesis function的結果
  • $x_0$ input node有時稱為bias unit,其值永遠為1
  • 在neural network中,會使用跟classification一樣的logistic function
    • $\frac{1}{1 + e^{-\theta^Tx}}$
    • 有時稱之為sigmoid (logistic) activation function
  • "theta" parameters有時也稱為"weights"
  • 最簡單的表示方式如下:
    • $\begin{bmatrix}x_0 \newline x_1 \newline x_2 \newline \end{bmatrix}\rightarrow\begin{bmatrix}\ \ \ \newline \end{bmatrix}\rightarrow h_\theta(x)$
    • input nodes位於input layer (layer 1),中間經過另一個node (layer 2),最後產出hypothesis function位於output layer
    • 在input跟output layer之間可能會有不只一層layer,稱其為hidden layers
  • 我們把hidden layer的node稱為activation unit
  • \begin{align*}& a_i^{(j)} = \text{"activation" of unit $i$ in layer $j$} \newline& \Theta^{(j)} = \text{matrix of weights controlling function mapping from layer $j$ to layer $j+1$}\end{align*}
  • 假設有一層hidden layer,會長的像下面這樣:
  • $\begin{bmatrix}x_0 \newline x_1 \newline x_2 \newline x_3\end{bmatrix}\rightarrow\begin{bmatrix}a_1^{(2)} \newline a_2^{(2)} \newline a_3^{(2)} \newline \end{bmatrix}\rightarrow h_\theta(x)$
  • 每一個activation node的值如下:
  • \begin{align*} a_1^{(2)} = g(\Theta_{10}^{(1)}x_0 + \Theta_{11}^{(1)}x_1 + \Theta_{12}^{(1)}x_2 + \Theta_{13}^{(1)}x_3) \newline a_2^{(2)} = g(\Theta_{20}^{(1)}x_0 + \Theta_{21}^{(1)}x_1 + \Theta_{22}^{(1)}x_2 + \Theta_{23}^{(1)}x_3) \newline a_3^{(2)} = g(\Theta_{30}^{(1)}x_0 + \Theta_{31}^{(1)}x_1 + \Theta_{32}^{(1)}x_2 + \Theta_{33}^{(1)}x_3) \newline h_\Theta(x) = a_1^{(3)} = g(\Theta_{10}^{(2)}a_0^{(2)} + \Theta_{11}^{(2)}a_1^{(2)} + \Theta_{12}^{(2)}a_2^{(2)} + \Theta_{13}^{(2)}a_3^{(2)}) \newline \end{align*}
  • 每一個layer有它自己的$\Theta^{(j)}$,則其dimension的定義如下:
    • 假設layer j有$s_j$個unit,layer j+1有$s_{j+1}$個unit,則$\Theta^{(j)}$的dimension為$s_{j+1} \times (s_j + 1)$
    • +1是因為多考慮bias node $x_0$跟$\Theta_0^{(j)}$
    • output不須考慮bias node,只有input需要考慮
  • 用vector的方式處理:
    • 將activation node以vector表示:$a(j)=g(z(j))$
    • 而$z^{(j)} = \Theta^{(j-1)}a^{(j-1)}$
    • 若還要計算下一層,就在$a^{(j)}$中加入一個bias unit
    • 就可以計算$z^{(j+1)} = \Theta^{(j)}a^{(j)}$

Examples and Intuitions I

  • 一個簡單的例子是以neural network預測$x_1$ AND $x_2$的結果,function會是如下:
  • \begin{align*}\begin{bmatrix}x_0 \newline x_1 \newline x_2\end{bmatrix} \rightarrow\begin{bmatrix}g(z^{(2)})\end{bmatrix} \rightarrow h_\Theta(x)\end{align*}
    • $x_0$是bias node,其值為1
  • Theta matrix則會是:$\Theta^{(1)} =\begin{bmatrix}-30 & 20 & 20\end{bmatrix}$
  • sigmoid function在z>4後趨近於1,z < 4後趨近於0

  • 所以可以算出如下結果:
  • \begin{align*}& h_\Theta(x) = g(-30 + 20x_1 + 20x_2) \newline \newline & x_1 = 0 \ \ and \ \ x_2 = 0 \ \ then \ \ g(-30) \approx 0 \newline & x_1 = 0 \ \ and \ \ x_2 = 1 \ \ then \ \ g(-10) \approx 0 \newline & x_1 = 1 \ \ and \ \ x_2 = 0 \ \ then \ \ g(-10) \approx 0 \newline & x_1 = 1 \ \ and \ \ x_2 = 1 \ \ then \ \ g(10) \approx 1\end{align*}

Examples and Intuitions II

  • 在上一節中,AND/OR/NOR都可以無須hidden layer就算出來
  • 但XNOR就需要多一層hidden layer才能求出,中間透過AND/OR/NOR的轉換


Multiclass Classification

  • 假設最後的結果不是只有2類,而是4類,那可用大小為4的vector來表示:

  • $h_\Theta(x)$ 會是這四種可能的vector其中之一


2017年9月18日 星期一

Week3

Classification


  • Binary classification problem
    • y只考慮是0或1,即y∈{0,1}
      • 0又稱為negative class,可用"-"表示
      • 1又稱為positive class,可用"+"表示

Hypothesis Representation

  • 將$h_\theta(x)$的形式改成如下形式
\begin{align*}0 \leq h_\theta (x) \leq 1 \end{align*}

  • 新的形式稱為Sigmoid FunctionLogistic Function
\begin{align*}& h_\theta (x) = g ( \theta^T x ) \newline \newline& z = \theta^T x \newline& g(z) = \dfrac{1}{1 + e^{-z}}\end{align*}


  • 下圖是Sigmoid Function的樣子


  • $h_\theta(x)$代表的是output為1的機率
    • 假設$h_\theta(x)=0.7$,代表有70%的機率output會是1
    • 而output是0的機率就是1-70%=30%

Decision Boundary

  • 為了要把結果做0跟1的分類,可以把hypothesis function的output轉譯成如下:
\begin{align*}& h_\theta(x) \geq 0.5 \rightarrow y = 1 \newline& h_\theta(x) < 0.5 \rightarrow y = 0 \newline\end{align*}
  • 從前面Sigmoid Function的圖可知當z > 0時,g(z) >= 0.5
  • 若z為$\theta^T X$則代表:
  • \begin{align*}& h_\theta(x) = g(\theta^T x) \geq 0.5 \newline& when \; \theta^T x \geq 0\end{align*}
  • 所以
  • \begin{align*}& \theta^T x \geq 0 \Rightarrow y = 1 \newline& \theta^T x < 0 \Rightarrow y = 0 \newline\end{align*}
  • Decision Boundary就是用來區分y=0跟y=1區域的那條線
    • 它不一定要直線,可以是圓形線或任何形狀

Cost Function

  • 若Logistic Function使用Linear Regression的Cost Function,則會是波浪的形狀有很多Local Optima
  • Logistic Regression的Cost Function如下
  • \begin{align*}& J(\theta) = \dfrac{1}{m} \sum_{i=1}^m \mathrm{Cost}(h_\theta(x^{(i)}),y^{(i)}) \newline & \mathrm{Cost}(h_\theta(x),y) = -\log(h_\theta(x)) \; & \text{if y = 1} \newline & \mathrm{Cost}(h_\theta(x),y) = -\log(1-h_\theta(x)) \; & \text{if y = 0}\end{align*}
  • 當y=1時會得到$J(\theta)$跟$h_\theta (x)$的圖


  • 當y=0時會得到$J(\theta)$跟$h_\theta (x)$的圖

  • 整理如下:
  • \begin{align*}& \mathrm{Cost}(h_\theta(x),y) = 0 \text{ if } h_\theta(x) = y \newline & \mathrm{Cost}(h_\theta(x),y) \rightarrow \infty \text{ if } y = 0 \; \mathrm{and} \; h_\theta(x) \rightarrow 1 \newline & \mathrm{Cost}(h_\theta(x),y) \rightarrow \infty \text{ if } y = 1 \; \mathrm{and} \; h_\theta(x) \rightarrow 0 \newline \end{align*}

Simplified Cost Function and Gradient Descent

  • 我們可以把上面的Cost()整合成一條式子
    • $\mathrm{Cost}(h_\theta(x),y) = - y \; \log(h_\theta(x)) - (1 - y) \log(1 - h_\theta(x))$
  • 整體的Cost Function如下表示:
    • $J(\theta) = - \frac{1}{m} \displaystyle \sum_{i=1}^m [y^{(i)}\log (h_\theta (x^{(i)})) + (1 - y^{(i)})\log (1 - h_\theta(x^{(i)}))]$
  • 用vector的方式實作如下:
  • \begin{align*} & h = g(X\theta)\newline & J(\theta) = \frac{1}{m} \cdot \left(-y^{T}\log(h)-(1-y)^{T}\log(1-h)\right) \end{align*}

Gradient Descent

  • Gradient Descent的表示式跟Linear Regression一樣
  • \begin{align*} & Repeat \; \lbrace \newline & \; \theta_j := \theta_j - \frac{\alpha}{m} \sum_{i=1}^m (h_\theta(x^{(i)}) - y^{(i)}) x_j^{(i)} \newline & \rbrace \end{align*}
  • 用vector的方式實作如下:
  • $\theta := \theta - \frac{\alpha}{m} X^{T} (g(X \theta ) - \vec{y})$

Advanced Optimization

  • 除了Gradient Descent之外有其他更好的方法
    • Conjugate gradient
    • BFGS
    • L-BFGS
  • 但是建議不要自己實做這些複雜的演算法,而是找已經最佳化過的Library
  • 我們需要提供一個Function去計算下面兩個結果
  • \begin{align*} & J(\theta) \newline & \dfrac{\partial}{\partial \theta_j}J(\theta)\end{align*}
  • 首先寫一個單一Function回傳這兩個結果
function [jVal, gradient] = costFunction(theta)
  jVal = [...code to compute J(theta)...];
  gradient = [...code to compute derivative of J(theta)...];
end


  • 接著用下面的function算出最佳解
options = optimset('GradObj', 'on', 'MaxIter', 100);
initialTheta = zeros(2,1);
[optTheta, functionVal, exitFlag] = fminunc(@costFunction, initialTheta, options);


Multiclass Classification: One-vs-all

  • 當類別超過兩類時,定義 y = {0,1...n}
  • 把這個問題分成n+1個Binary Classification Problem,將最大的結果當成預測值
  • \begin{align*}& y \in \lbrace0, 1 ... n\rbrace \newline& h_\theta^{(0)}(x) = P(y = 0 | x ; \theta) \newline& h_\theta^{(1)}(x) = P(y = 1 | x ; \theta) \newline& \cdots \newline& h_\theta^{(n)}(x) = P(y = n | x ; \theta) \newline& \mathrm{prediction} = \max_i( h_\theta ^{(i)}(x) )\newline\end{align*}
   

Regularization

  • 為了避免overfitting,可以在cost function中加上對weight的懲罰,所以cost function改寫如下:
    • $min_\theta\ \dfrac{1}{2m}\ \sum_{i=1}^m (h_\theta(x^{(i)}) - y^{(i)})^2 + \lambda\ \sum_{j=1}^n \theta_j^2$
  • Regularized Linear Regression
    • Gradient Descent
      • 演算法改寫如下,要注意的是並沒有對$\theta_0$做懲罰
      • \begin{align*} & \text{Repeat}\ \lbrace \newline & \ \ \ \ \theta_0 := \theta_0 - \alpha\ \frac{1}{m}\ \sum_{i=1}^m (h_\theta(x^{(i)}) - y^{(i)})x_0^{(i)} \newline & \ \ \ \ \theta_j := \theta_j - \alpha\ \left[ \left( \frac{1}{m}\ \sum_{i=1}^m (h_\theta(x^{(i)}) - y^{(i)})x_j^{(i)} \right) + \frac{\lambda}{m}\theta_j \right] &\ \ \ \ \ \ \ \ \ \ j \in \lbrace 1,2...n\rbrace\newline & \rbrace \end{align*}
      • 在經過整理後如下:
        • $\theta_j := \theta_j(1 - \alpha\frac{\lambda}{m}) - \alpha\frac{1}{m}\sum_{i=1}^m(h_\theta(x^{(i)}) - y^{(i)})x_j^{(i)}$
        • 由於$1 - \alpha\frac{\lambda}{m}$ 永遠會小於1,而後面的項目跟沒做regularization前一樣,所以weight會減小的範圍就決定在$1 - \alpha\frac{\lambda}{m}$
    • Normal Equation
      • 式子改寫如下:
      • \begin{align*}& \theta = \left( X^TX + \lambda \cdot L \right)^{-1} X^Ty \newline& \text{where}\ \ L = \begin{bmatrix} 0 & & & & \newline & 1 & & & \newline & & 1 & & \newline & & & \ddots & \newline & & & & 1 \newline\end{bmatrix}\end{align*}
      • 前面提過若m<n則$X^TX$是不可逆的,但在改寫後$X^TX$ + λ⋅L是可逆的。
  • Regularized Logistic Regression
    • 和Regularized Linear Regression的方法一樣

Week2

Multiple Features

  • 有多個變數的Linear Regression稱為multivariate linear regression
  • 符號說明如下:
\begin{align*}x_j^{(i)} &= \text{value of feature } j \text{ in the }i^{th}\text{ training example} \newline x^{(i)}& = \text{the input (features) of the }i^{th}\text{ training example} \newline m &= \text{the number of training examples} \newline n &= \text{the number of features} \end{align*}
  • 其hypothesis function的形式為:
\begin{align*}h_\theta (x) = \theta_0 + \theta_1 x_1 + \theta_2 x_2 + \theta_3 x_3 + \cdots + \theta_n x_n\end{align*}
  • 也可用matrix的形式來表示:
\begin{align*}h_\theta(x) =\begin{bmatrix}\theta_0 \hspace{2em} \theta_1 \hspace{2em} ... \hspace{2em} \theta_n\end{bmatrix}\begin{bmatrix}x_0 \newline x_1 \newline \vdots \newline x_n\end{bmatrix}= \theta^T x\end{align*}


Gradient Descent For Multiple Variables

  • 演算法如下:

\begin{align*} & \text{repeat until convergence:} \; \lbrace \newline \; & \theta_0 := \theta_0 - \alpha \frac{1}{m} \sum\limits_{i=1}^{m} (h_\theta(x^{(i)}) - y^{(i)}) \cdot x_0^{(i)}\newline \; & \theta_1 := \theta_1 - \alpha \frac{1}{m} \sum\limits_{i=1}^{m} (h_\theta(x^{(i)}) - y^{(i)}) \cdot x_1^{(i)} \newline \; & \theta_2 := \theta_2 - \alpha \frac{1}{m} \sum\limits_{i=1}^{m} (h_\theta(x^{(i)}) - y^{(i)}) \cdot x_2^{(i)} \newline & \cdots \newline \rbrace \end{align*}


  • Feature Scaling
    • 當Feature的range很大時,Descent的速度會很慢
    • Input Variable的理想range
      • −1 ≤ x(i) ≤ 1
      • 大約就好,太大太小都不好
    • Mean normalization
      • μi 是feature (i)的平均值
      • si 是the range of values (max - min)或標準差
      • \begin{align*}x_i := \dfrac{x_i - \mu_i}{s_i}\end{align*}

Normal Equation

  • 為了得到Cost Function J的最小值,可以針對各個θi做偏微分後設成0,就可以求出θ的最佳解如下:
\begin{align*}\theta = (X^T X)^{-1}X^T y\end{align*}


  • X, y的例子如下


  • 使用Normal Equation就不需要做Feature Scaling
  • Gradient Descent跟Normal Equation的比較如下:

Gradient DescentNormal Equation
Need to choose alphaNo need to choose alpha
Needs many iterationsNo need to iterate
O (kn2)O (n3), need to calculate inverse of XTX
Works well when n is largeSlow if n is very large

  • 實作上當n超過10000的時候就會考慮用Gradient Descent

Normal Equation Noninvertibility

  • 如果X^T X是不可逆的,可能的原因如下:
    • 有重複的Feature出現 (如線性相關的兩個Feature(ft/m))
    • Feature數量太多 (m≤ n)
      • 刪除一些Feature或做Regularization


2017年9月6日 星期三

Week1

Supervised Learning


  • 定義:
    • 有一筆已知正確結果的資料,找出input和output之間的關係。
  • 分成兩類的問題
    • Regression
      • 在一組連續的output中預測結果
      • 把input variables map到連續性的function
    • Classification
      • 預測的結果為一組離散的(discrete) output
      • 把input variables map到離散的類別

Unsupervised Learning


  • 對於結果會長怎樣所知甚少甚至是完全不知道
  • 從資料中的variables找出關聯性並將資料分成小的group
  • 例子:
    • Clustering
      • 將基因做分群
    • Non-Clustering
      • 將音訊檔區別人聲和音樂聲

Model Representation


  • 對於supervised learning problem,流程如下圖。從Training set train出一個function h,這個h由於歷史因素稱為hypothesis


Cost Function

  • 用來計算hypothesis精確度的function稱為cost function如下


  • 他又稱為Squared error functionMean squared error
  • 1/2是用來做gradient descent時較方便計算,作微分後就可以把1/2給消掉

Gradient Descent


  • 以下是 Gradient Descent的演算法,一直repeat直到收斂為止


  • 不同的起點可能會導致最後找到的local minimum點不同
  • α代表的是Step的參數
    • 太小=>收斂很慢
    • 太大=>無法收斂或甚至變成發散
  • 越接近local minimum,斜率就會越小,整體Step自然也越小,所以不需要去減小α


2017年8月26日 星期六

Week6


Nearest neighbor regression

  • 資料有可能在不同區段有不同的關係存在


  • 當我們要預測一個x的value時,選擇資料中和x最接近的並將其value作為預測結果,這個方法稱為1 Nearest Neighbot (1-NN) regression


  • 如果只有一個Feature,距離很好計算,就是用兩者相減後的絕對值表示(Euclidean Distance)


  • 如果有多個Feature,那就針對各個Feature根據重要性給予權重,以下列公式計算(Scaled Euclidean Distance):


  • 用圖形化來表示1-NN (Voronoi Tessellation/Diagram) 
    • 把空間分成N個區域,每個區域裡面只有一個資料點Xi
    • 在任一區域裡面的點X最近的資料點一定是該區域的資料點
    • 對距離有不同定義,則會產生出不同結果的圖


1-NN Algorithm

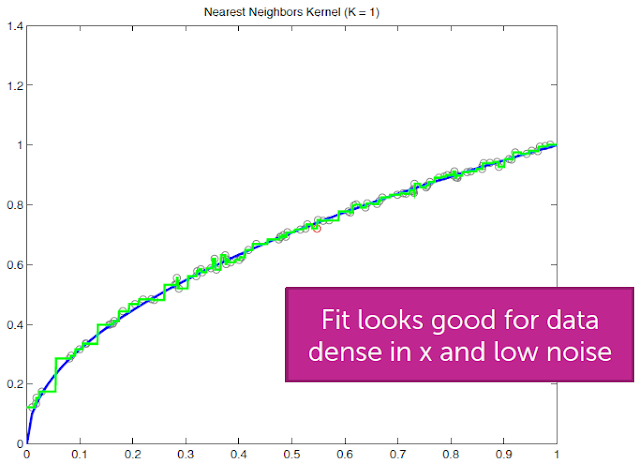
  • 演算法如下,找出和所query的東西最相近的結果


  • 當資料量大而且Noise很小時預測結果會很準確


  • 在資料間隔比較大的地方會失準


  • 若Noise很大,則結果看起來像是Overfitting


k-Nearest neighbors

  • 前面提到1-NN在Noise較大時會有失準的問題,所以若能擴大計算預估值的比較資料Set比較能平衡Noise的問題。
  • k-NN Regression
    • 我們可以找出最接近的k個資料,計算其平均值來當作預測結果
  • k-NN Algorithm
    • 首先將前k個資料做距離的排序後放到一個Array
    • 從第k+1個開始到第N個資料,若比第k個資料的距離還近的話就把該資料插入到Array中
    • 最後就可以求出最接近的k個資料


  • 下圖說明使用k-NN可以減少Noise造成的影響
  • 但在左右兩邊邊界由於取的k個資料都會一樣,所以會變成相同預測值的水平直線
  • 資料量少的區域也一樣會有失準的問題


  • Discontinuities
    • 還有一個問題就是預測的結果不是連續的,當X的單位只改變1時,有可能會造成相差很多的結果。
    • 在某些應用下不能太相信此種結果,例如範例中的房價預測。

Weighted k-NN

  • 為了解決前面提到不連續的問題,我們可以把這k個結果分別取權重讓預測值更準確及smooth。


  • 要怎麼決定權重呢?
    • 距離越小者權重越高
    • 距離越大者權重越低
    • 最簡單的方式就是將權重設成
      • 1/距離

  • Kernel weights for d=1
    • 其他有一些比較複雜的設定權重方式統稱為kernel weight
    • Gaussian kernel是其中一個例子
      • 𝜆可用來設定smooth的程度
      • 它比較特別的是權重永遠不會是0
  • Kernel weights for d≥1
    • 和d=1的差別在於所帶入的距離函式

Kernel Regression

  • 不是只在NN中取權重,而是把所有的Data Point都取權重
    • 稱為Nadaraya-Watson kernel weighted average
  • 下圖是以Epanechinikov Kernel為例
    • 所選擇的Kernel會限定一個區域(圖中黃色部分),只有在這個區域內的資料才會拿來計算

  • 𝜆的選擇比Kernel的選擇還重要!
    • 𝜆代表的是所限制的區域大小(Bandwidth)
    • 𝜆太小(如圖最左)仍然會有Overfitting造成Variance增大
    • 𝜆太大(如圖最右)又過於平滑造成Bias增大
    • 𝜆的選擇也是Bias-Variance Tradeoff
  • 𝜆和k的選擇最好的方式
    • Cross Validation

Formalizing the idea of local fits

  • Global constant fit
    • 𝜆=1且所有Data Point的權重都一樣
    • 結果就會是一條水平直線
  • Locally constant fit
    • Kernel Regression屬於此種
  • Local Regression
    • 目前討論的都是locally在每個點去fit constant function
      • locally weighted averages
    • 若我們想locally在每個點去fit line/polynomial呢?
      • locally weighted linear regression
        • local linear fit
          • 減少邊界的bias但稍微增加variance
        • local quadratic fit
          • 對邊界問題無用且會增加variance
          • 減少邊界外中間區域的bias
        • 單數degree的polynomial會比偶數degree好
      • 最建議的選擇:
        • local linear regression

Discussion on k-NN and kernel regression

  • Nonparametric regression
    • Nonparametric的目標
      • 有彈性
      • 對f(x)只要做少量的假設
      • 複雜度會隨著觀測資料數量N增加而跟著增加
    • k-NN及kernel regression即為此種
    • 其他還有Splines, trees, locally weighted structured regression models…
  • Noiseless setting
    • 若資料皆沒有Noise
      • 隨著資料量越來越多
        • 1-NN Fit的MSE越來越小
      • 當資料量到無限多
        • 1-NN Fit的MSE趨近0
    • Quadratic Fit則是就算資料量到無限多,仍然不可能完全Fit函式,一定會存在Bias

  • Noisy data setting
    • 當資料量為無限多
      • k越大,NN fit的MSE越小,最後也是會趨近0

  • Large d or small N
    • NN和kernel regression在資料可以覆蓋整個space的情況下運作很好
    • 當dimension d越多,需要越多資料數N去覆蓋space
    • N = O(exp(d))才有好的performance
    • 這也是為什麼parametric model是有其用途的
  • Complexity of NN search
    • 若是採Brute force search
      • 給一個Query point xq
      • 掃過x1,x2,…, xN
      • 對1-NN來說要做O(N)次的距離計算
      • 對k-NN來說是O(Nlogk) [logk是做排序]

k-NN for classification

  • 以區分垃圾郵件為例
  • Space即為佈滿著已經分好類的email
  • Query email可藉由k-NN找出最相似的k個email
    • 看這k個email是垃圾郵件較多還是非垃圾郵件較多
    • 即可決定此郵件是哪一類


2017年8月23日 星期三

Week5

Feature selection task 


  • 若在做prediction時weight的數目超多,這樣要花大量的時間來運算
  • 若weight的數量很少(sparse),只計算weight不為0的,這樣就有比較好的efficiency
  • 另一方面來說,只加入真正跟prediction有關的feature也比較具有代表性(Interpretability)

Option 1: All subset

  • 從選擇0個Feature開始,一直到8個全選,每次都找出最小的RSS組合


  • Complexity:
    • 假設有D個Feature
    • 總共要計算的model數量為2的D+1次方 (因為包含constant)
Option2: Greedy algorithms

  • 和All subset類似,差別在於每選完一個數量的feature,選下一個數量的時候必須包含先前選的


  • Complexity
    • Steps:
      • 選0個1次
      • 選1個D次
      • 選2個D-1次
      • ...
      • 選D個1次


Regularize


  • 選擇Feature的時候使用regularization
    • 從full model開始(選擇所有feature)
    • 把某些coefficient shrink到0
    • 非0的coefficient代表所選擇的feature
  • 設定一個coefficient的threshold,小於threshold的coefficient就shrink為0


  • Lasso regression


  • Coefficient path
    • Ridge
      • 就算𝛌很大,coefficient還是很小但不會是0的值


    • Lasso
      • 可以看到𝛌還沒有到很大的數字時,就已經有好幾個coefficient被shrink為0了

Fitting the lasso regression model (for given 𝛌)


  • 由於絕對值wj無法微分,所以沒辦法算出lasso regression的closed-form solution


  • Coordinator descent


  • 對Feature做Normalize

  • Coordinate descent for unregularized regression (for normalized features)


    • Coordinator Descent演算法


  • Coordinate descent for lasso (for normalized features)

      • 演算法:


      • Threshold即為-𝛌/2到𝛌/2之間


      • 怎麼決定演算法是否收斂完成
        • 對Convex Problem來說,step會越來越小
        • 統計每次loop所有Feature的step
          • 當最大的step < 𝛆時就代表收斂完成